Problematic Party Politics
We believe there are 3 fundamental problems that we’d like to focus on.
Corruption, Ideological Dogma, Disproportionate Representation
Let's start with the obvious. Corruption.
We see evidence of this in every party. From ridiculous and frivolous expense claims, embezzlement, accepting bribes, cronyism, fraud and no shortage of affairs and sexual deviancy. The list seems endless.
Just take a look at this wikipedia list of scandals.
No doubt that’s only the half of it.
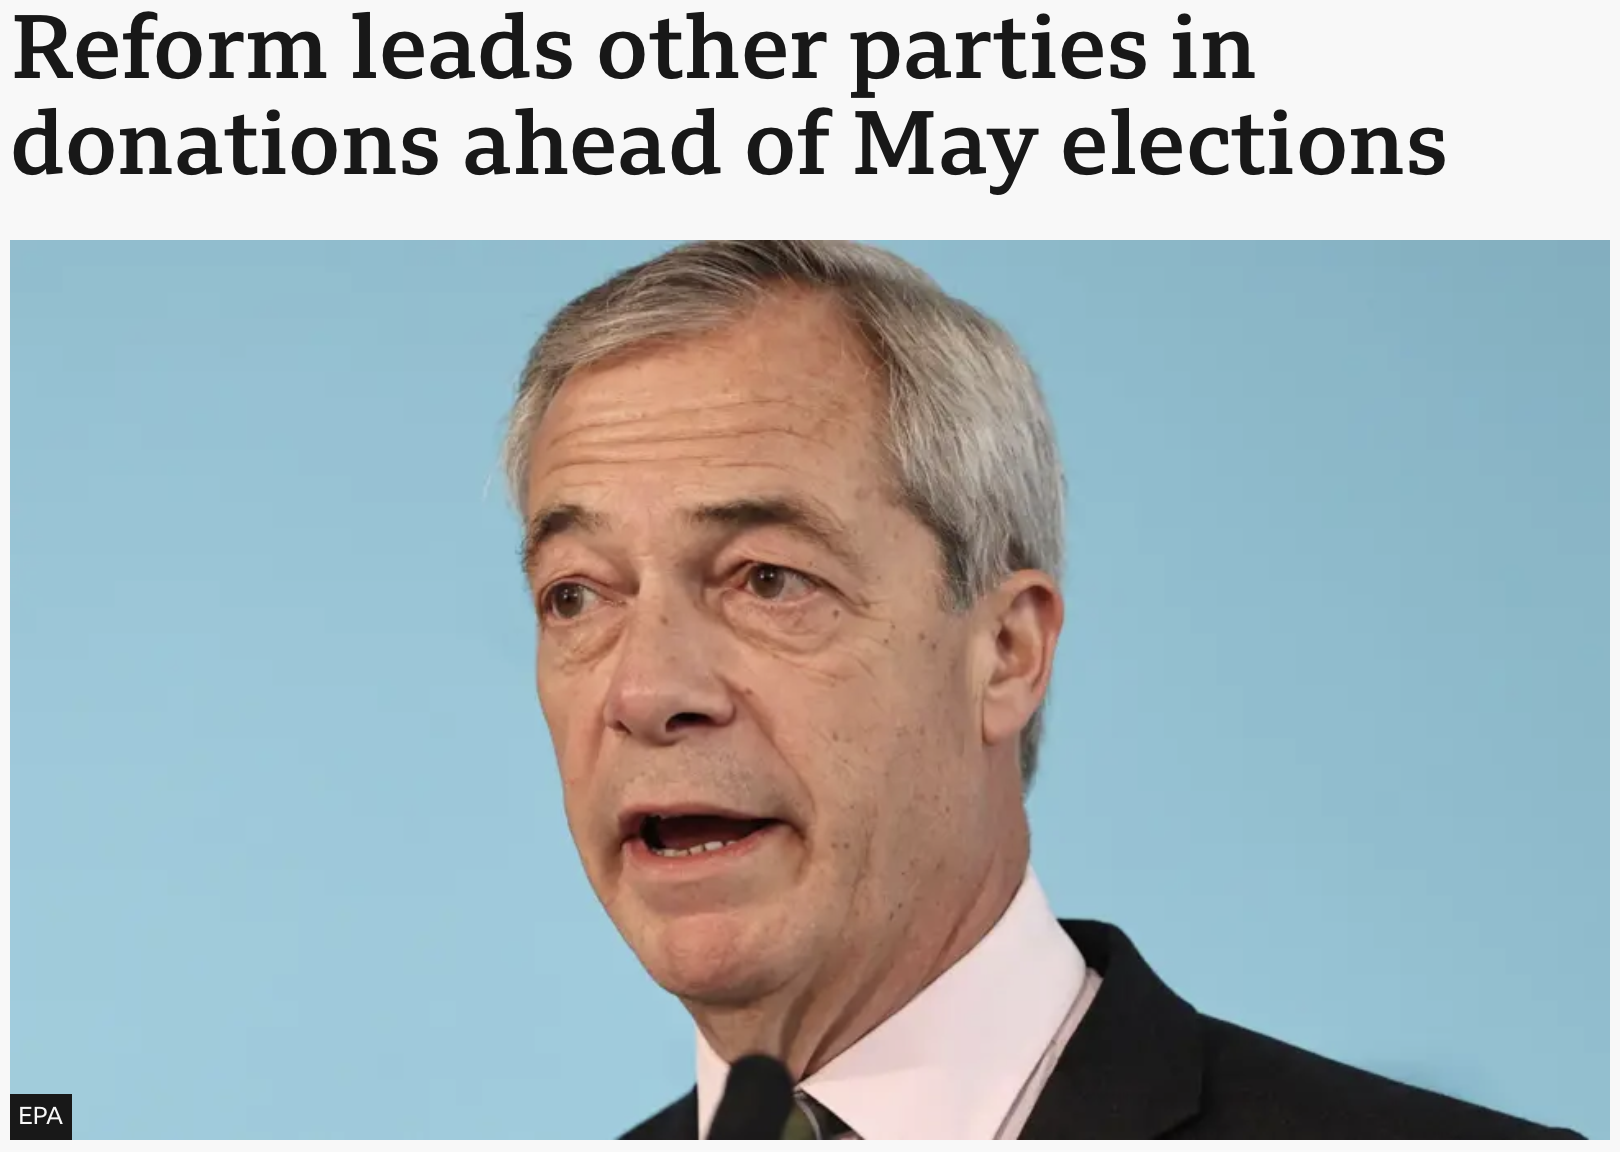
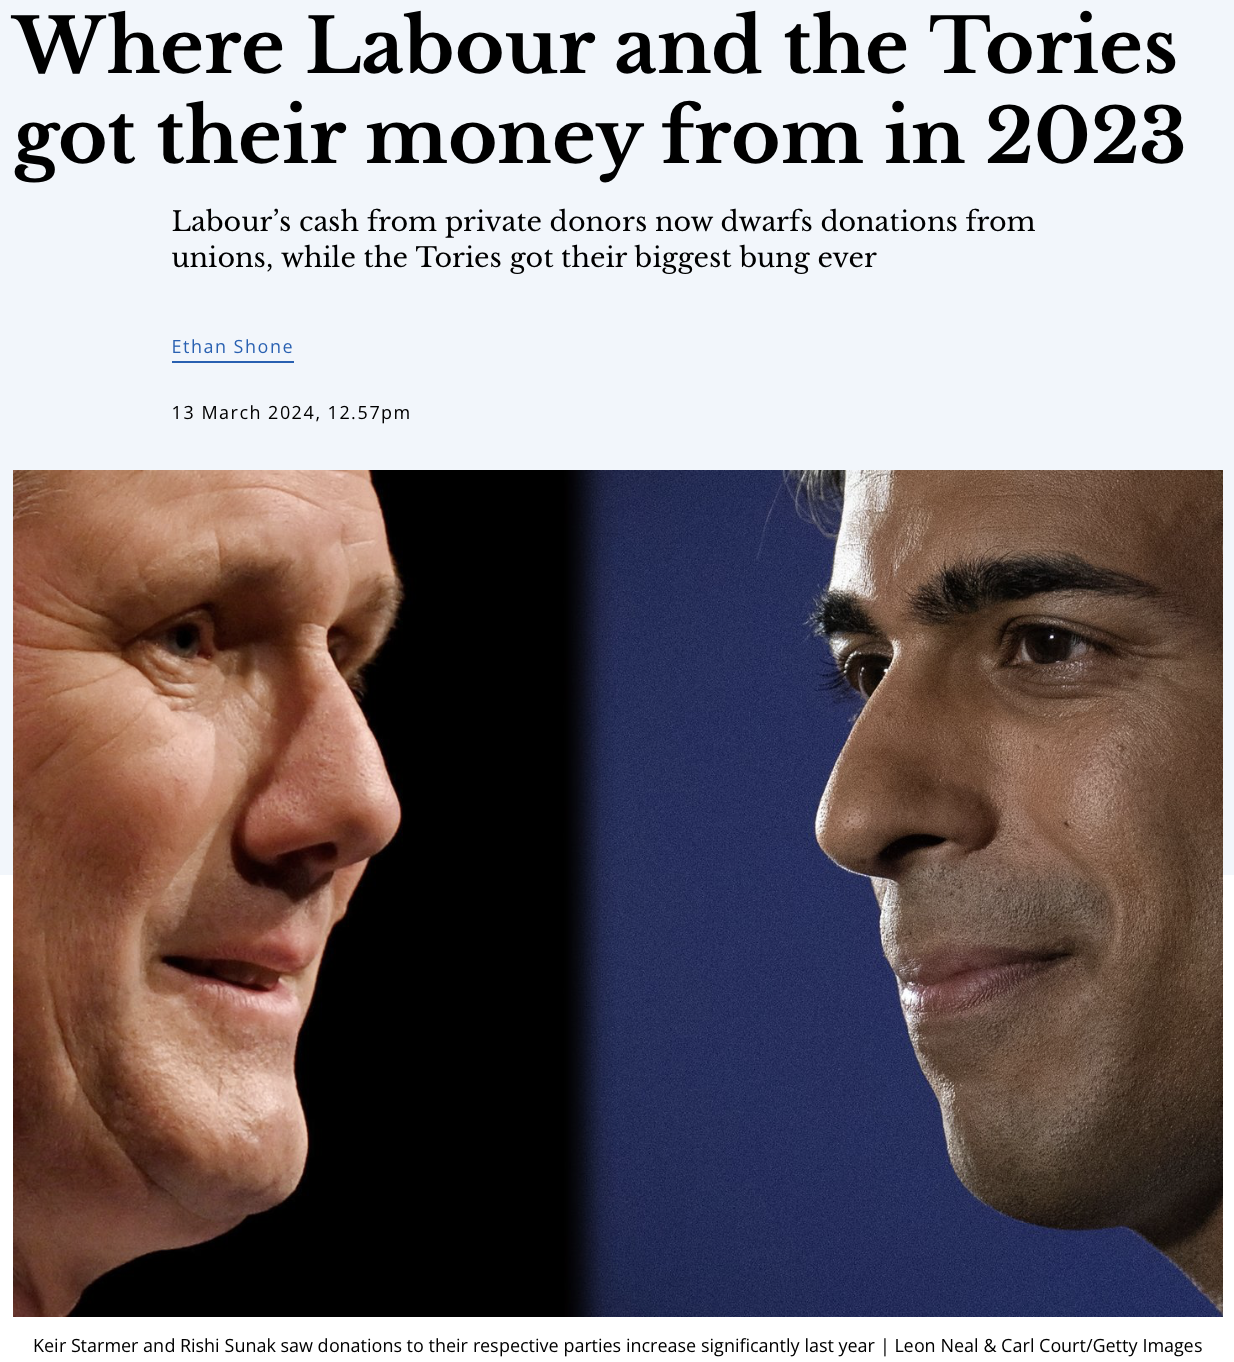
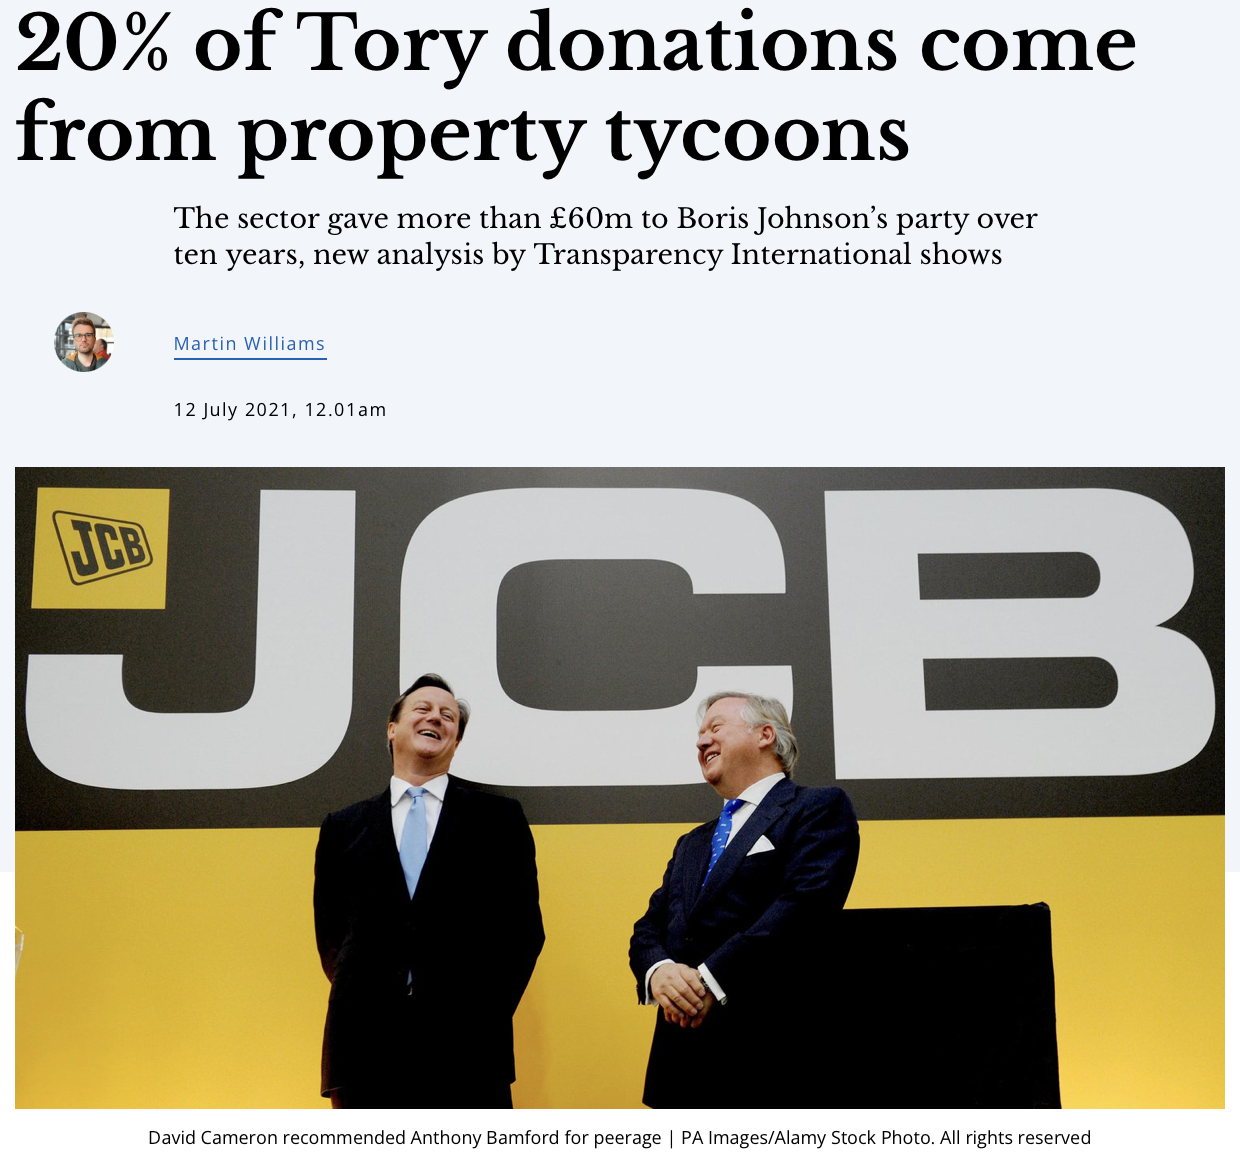
Beyond the headlines there’s the financial backers. Every party has to funded somehow!
Wealthy companies and individuals can donate to political parties. This obviously puts the people receiving the money in a compromised position. Receiving funds from small business is one thing but when giant companies you’ve never heard of with millionaire/billionaire share holders who have no interest in the daily lives of common folk want to see a return on their investments then all they need to do is pull the strings on their political puppets.
Ideological Dogma
Ideologies are “a set of beliefs, values and ideas” and political parties are the embodiment of an ideology.
These beliefs aren’t just a set, they are set, as in set in stone. Meaning they don’t change, at least not easily.
The nature of a belief is that they are certain truths to those who have them, be it political or religious. So the stronger someone’s belief the harder it is to change their minds or for them to accept new or contrary information. They are dogmatic, zealous, self righteous and narrow minded.
- That isn’t meant to be insulting, they are entitled to their opinions and beliefs and they might even be right
So our problem isn’t with any particular policy or belief, our issue is that political parties are dogmatic. Ideologies being so reluctant to accept alternative views makes them incompatible with democracy which is about accepting consensus even if you disagree.
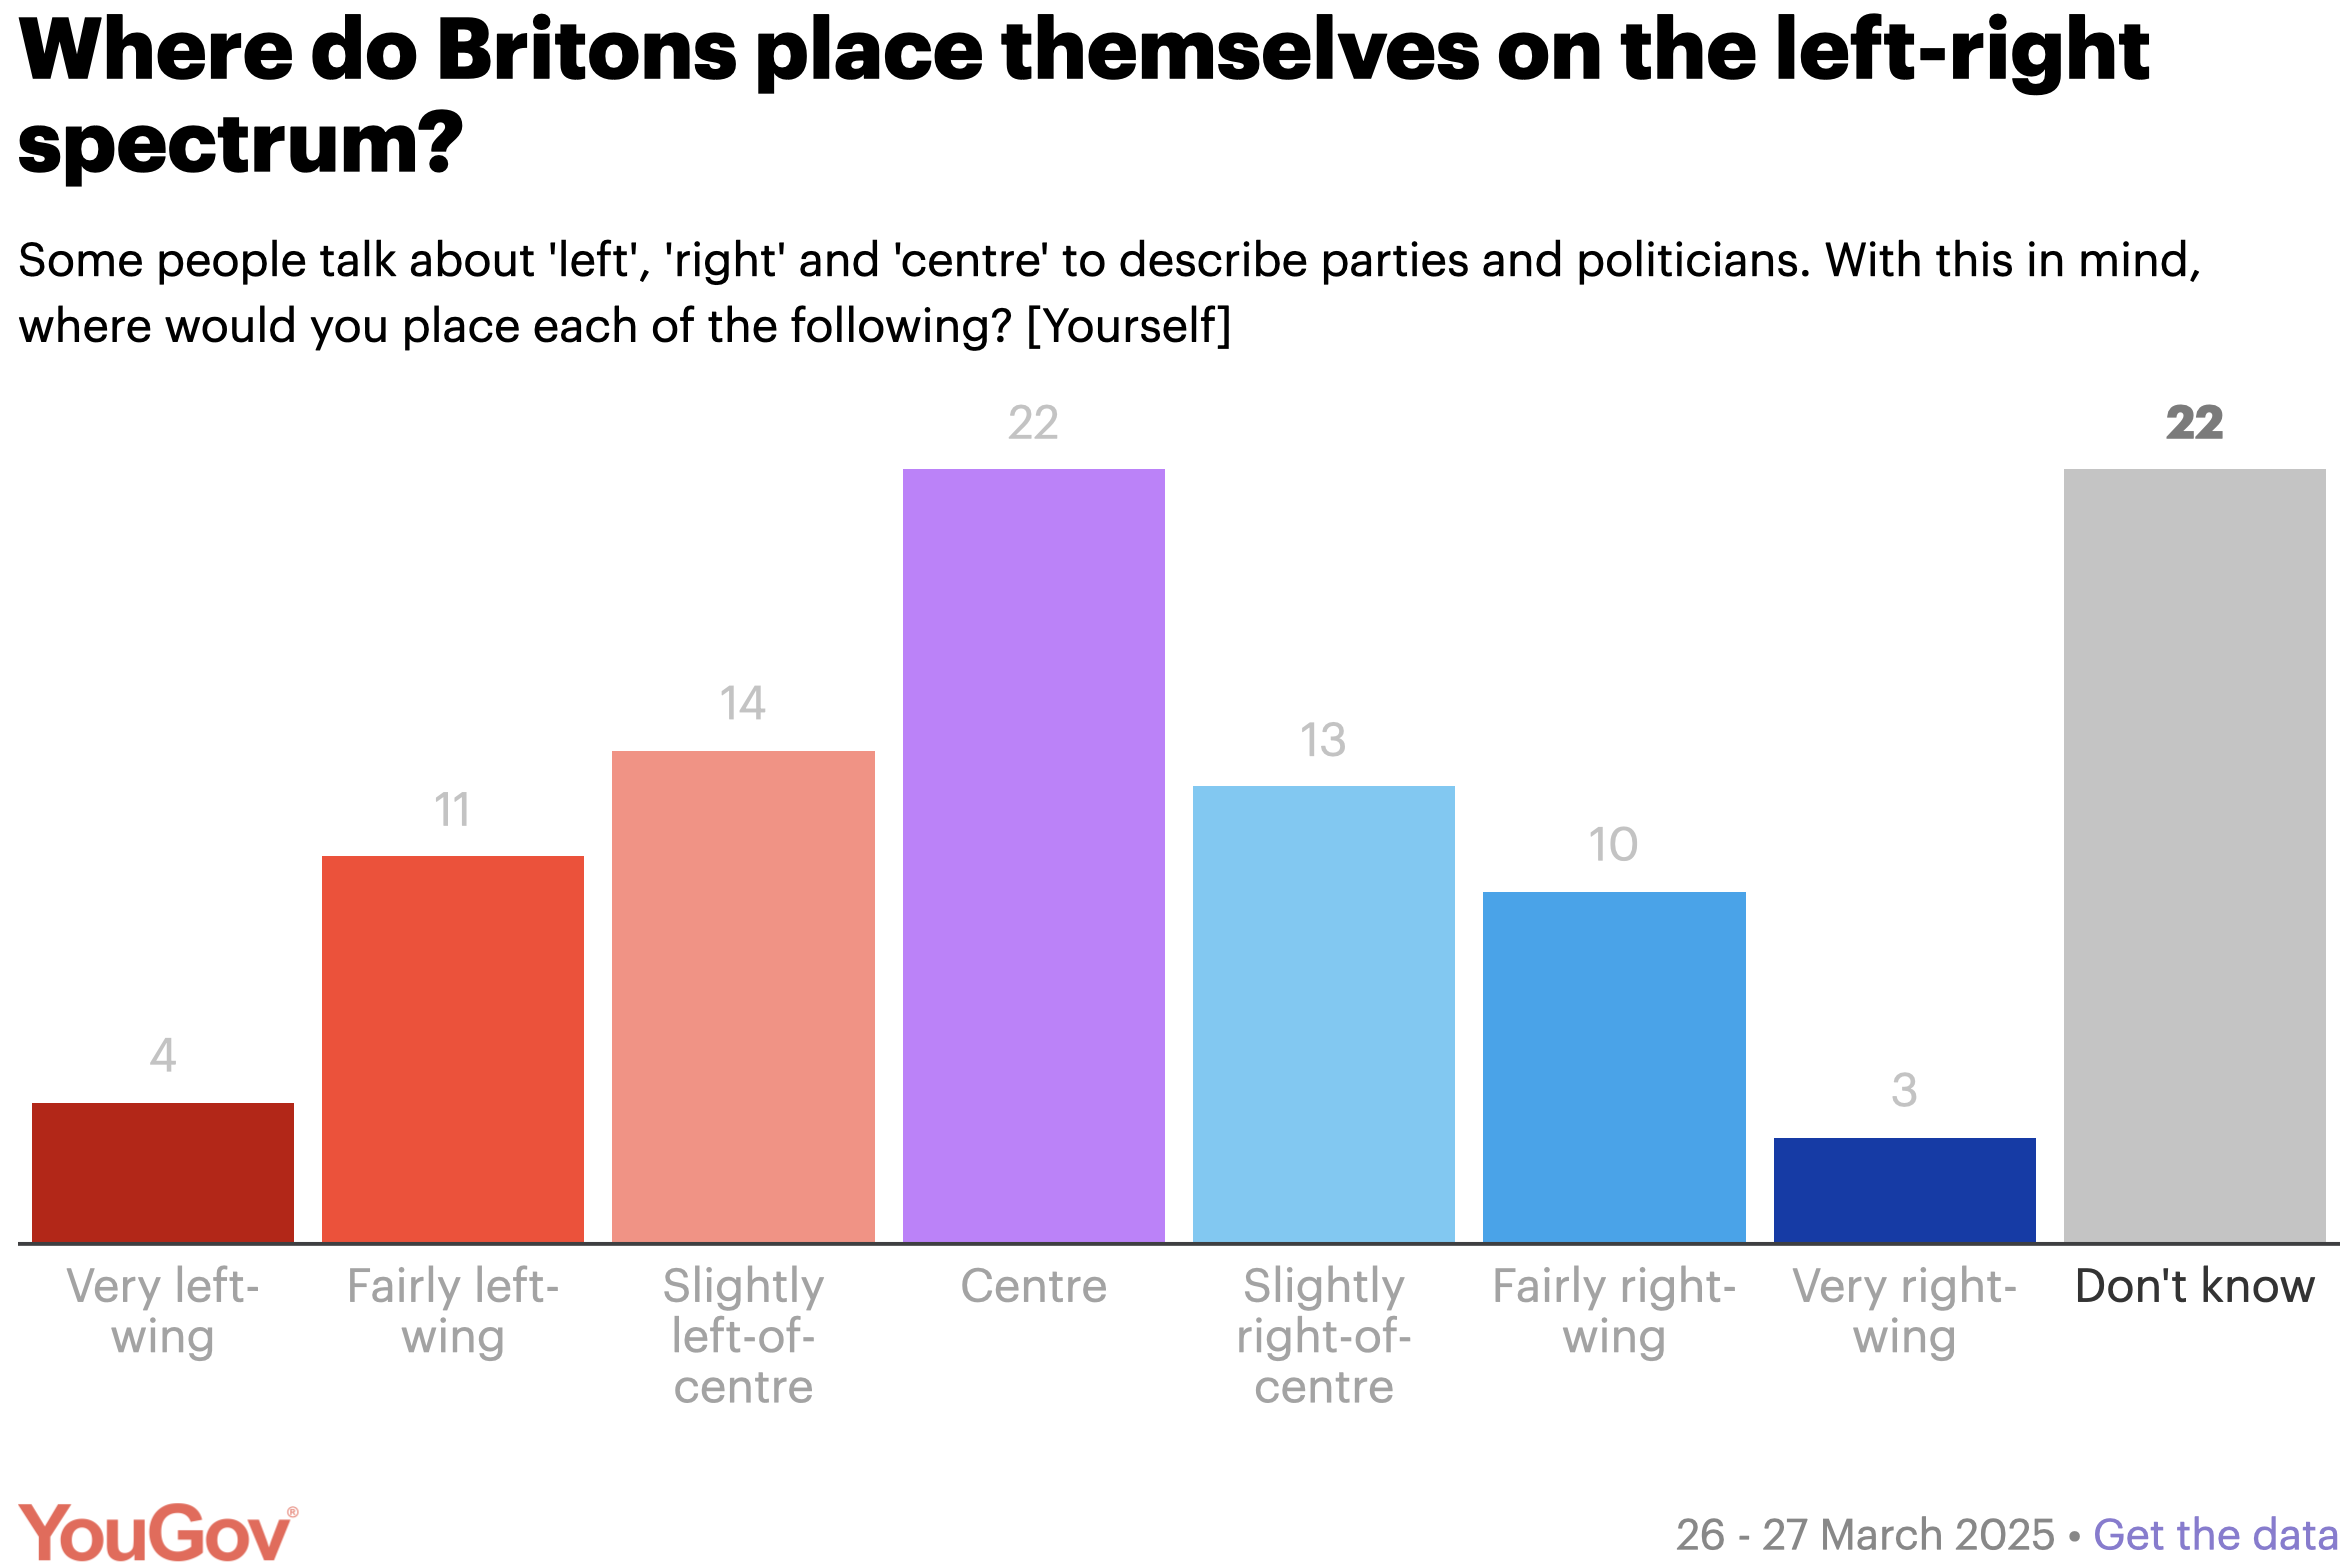
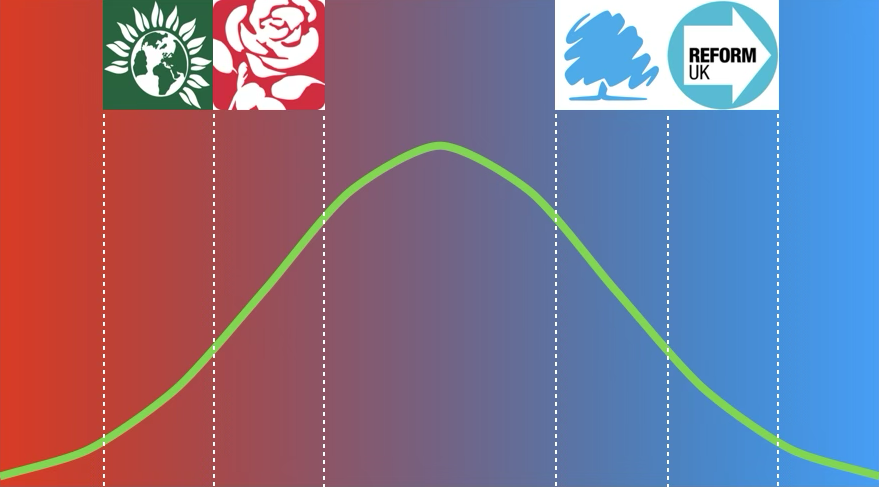
YouGovs own data shows how the public align themselves on the political spectrum.
Even from this limited survey it’s clear that given a larger sample size you’d see a bell curve.
This isn’t really surprising, it makes sense that the further towards either end the less support there would be, hence why we call them “far right/left” or “extreme”
Mathematically it makes sense too. Take the following list of government departments and for each one simply decide left or right or flip a coin.
Business & Trade
Energy Security & Net Zero
Transport
Foreign, Commonwealth & Development
Ministry of Defence
Culture, Media & Sport
Environment, Food & Rural Affairs
Work & Pensions
HM Treasury
Housing, Communities & Local Government
Education
Science, Innovation & Technology
Health & Social Care
Home Office
Ministry of Justice
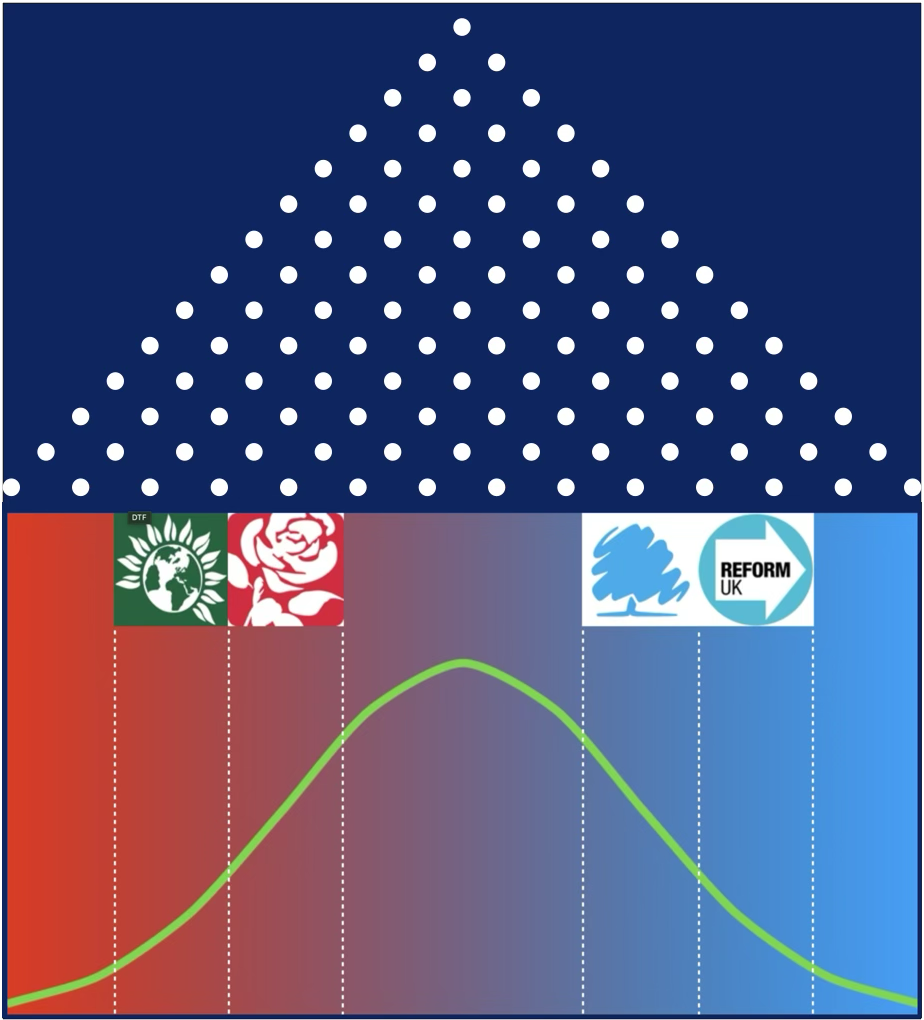
You may recognise this as a Galton board.
This doesn't just demonstrate how we distribute ourselves on the political spectrum.
It can also demonstrate the ineffectiveness of a singular political party controlling everything.
Everything discussed in parliament has its own complications, moral implications and nuances that make our decisions a complex, subjective, educated guess. If anything was objectively true then there’d be no need to discuss it in parliament.
Now assign a ball to each department of government and drop them all into the Galton board.
Given that we don’t actually know anything, it’s anyones guess where the ball for each department will land. Wherever it lands is the optimal direction to take for that department.
Each party has their own lane and they ‘believe’ every ball will land in their lane. They believe they have the optimal path for every department.
But mathematically that’s incredibly unlikely. You could do this hundreds of thousands of times, maybe even millions and never catch every ball in one lane.
Ideological parties are just too narrow minded and dogmatic to be able to cover all the bases.
Disproportionate Representation
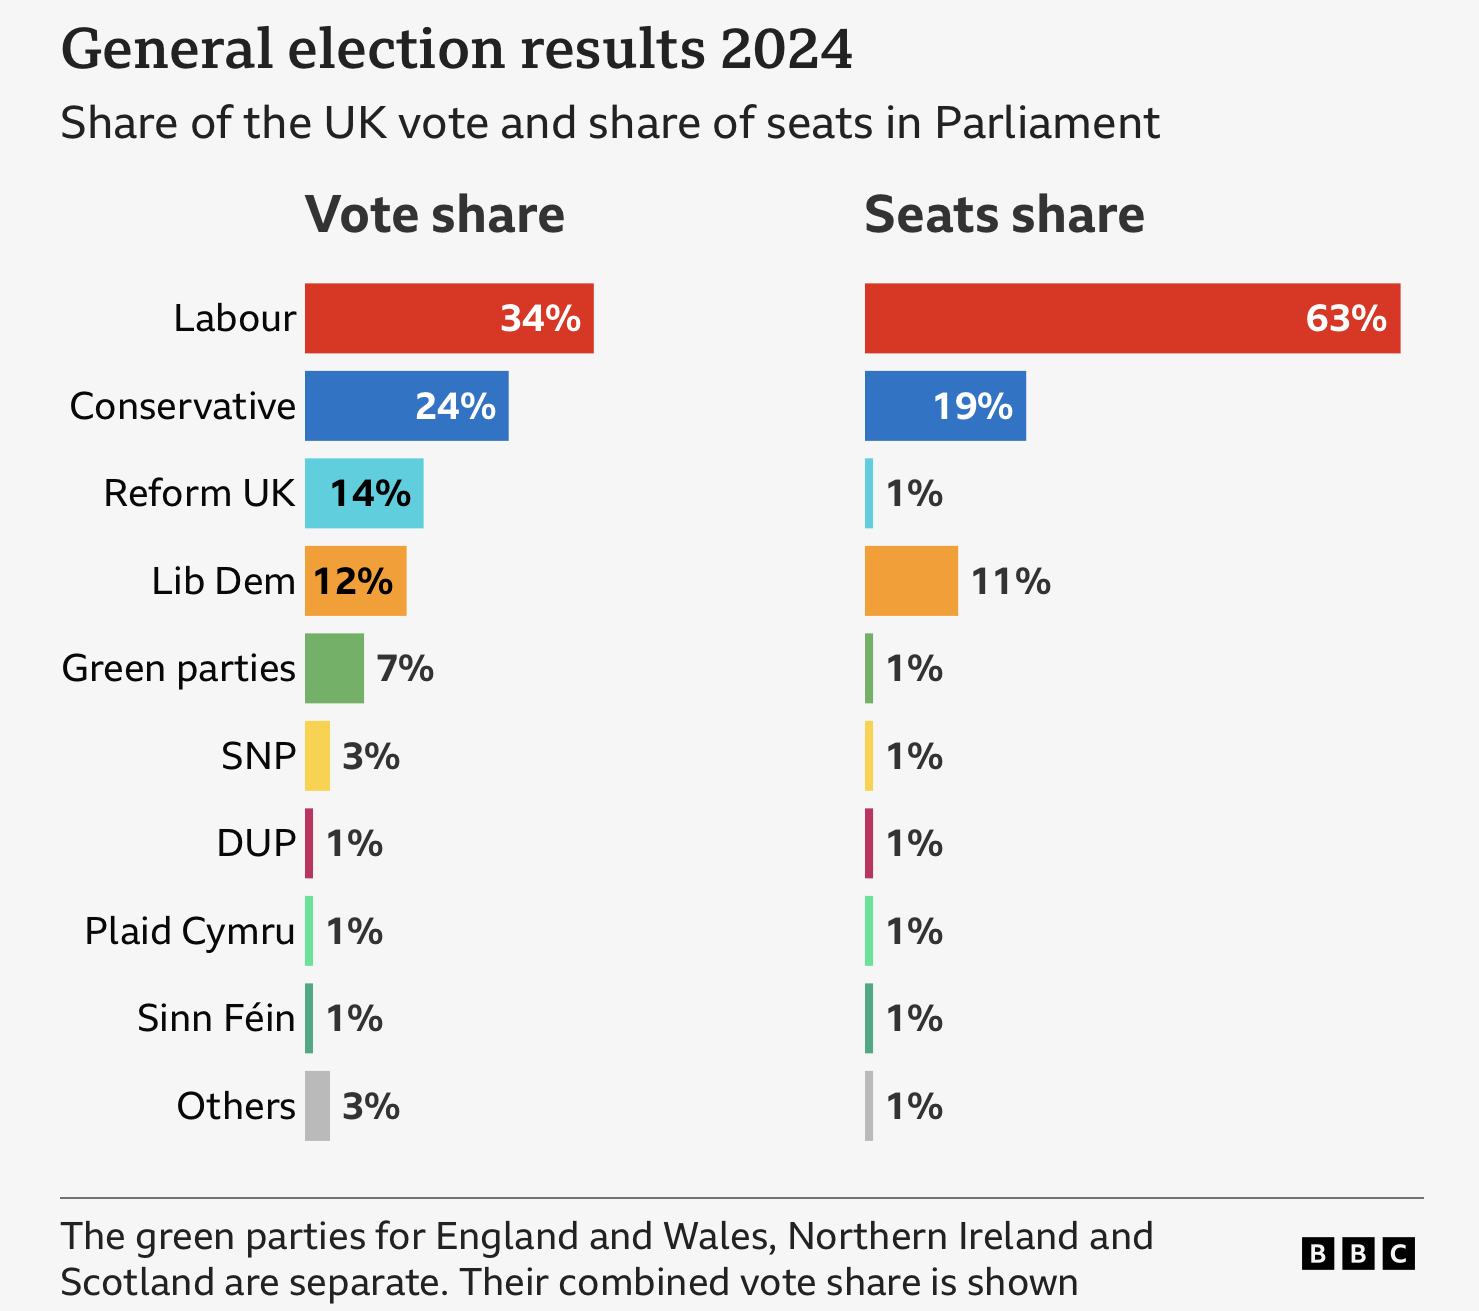
According to the BBC Labour received 34% of the public vote and 63% of the seats in parliament. Meanwhile Reform got 14% of the vote but only 1% of the seats.
The ratio of seats to votes is clearly different, hence disproportionate.
Voting practices are better explained at electoral-reform.org.uk
They have been campaigning for improvements to voting practices since 1884.
Which goes to show how slow our system is to change.
Results for each seat are posted at https://members.parliament.uk. We took those figures and compiled them into a spreadsheet to look the numbers in greater detail and what we found was concerning.
Of the 650 seats in parliament, 555 of them were won with a share of the votes below 50%.
That’s just 14.6% of seats that were won with a consensus.
On average it took only 42.4% of votes in order to win a seat.
The lowest vote share that still won their seat was just 26.7%.
So each seat individually has pretty poor representation and subsequently most governments formed do not represent the nation.
This is evident simply by looking at the bell curve of how we align ourselves politically against the range of ideals each party represents.
It doesn't matter which party wins, the majority always lose.
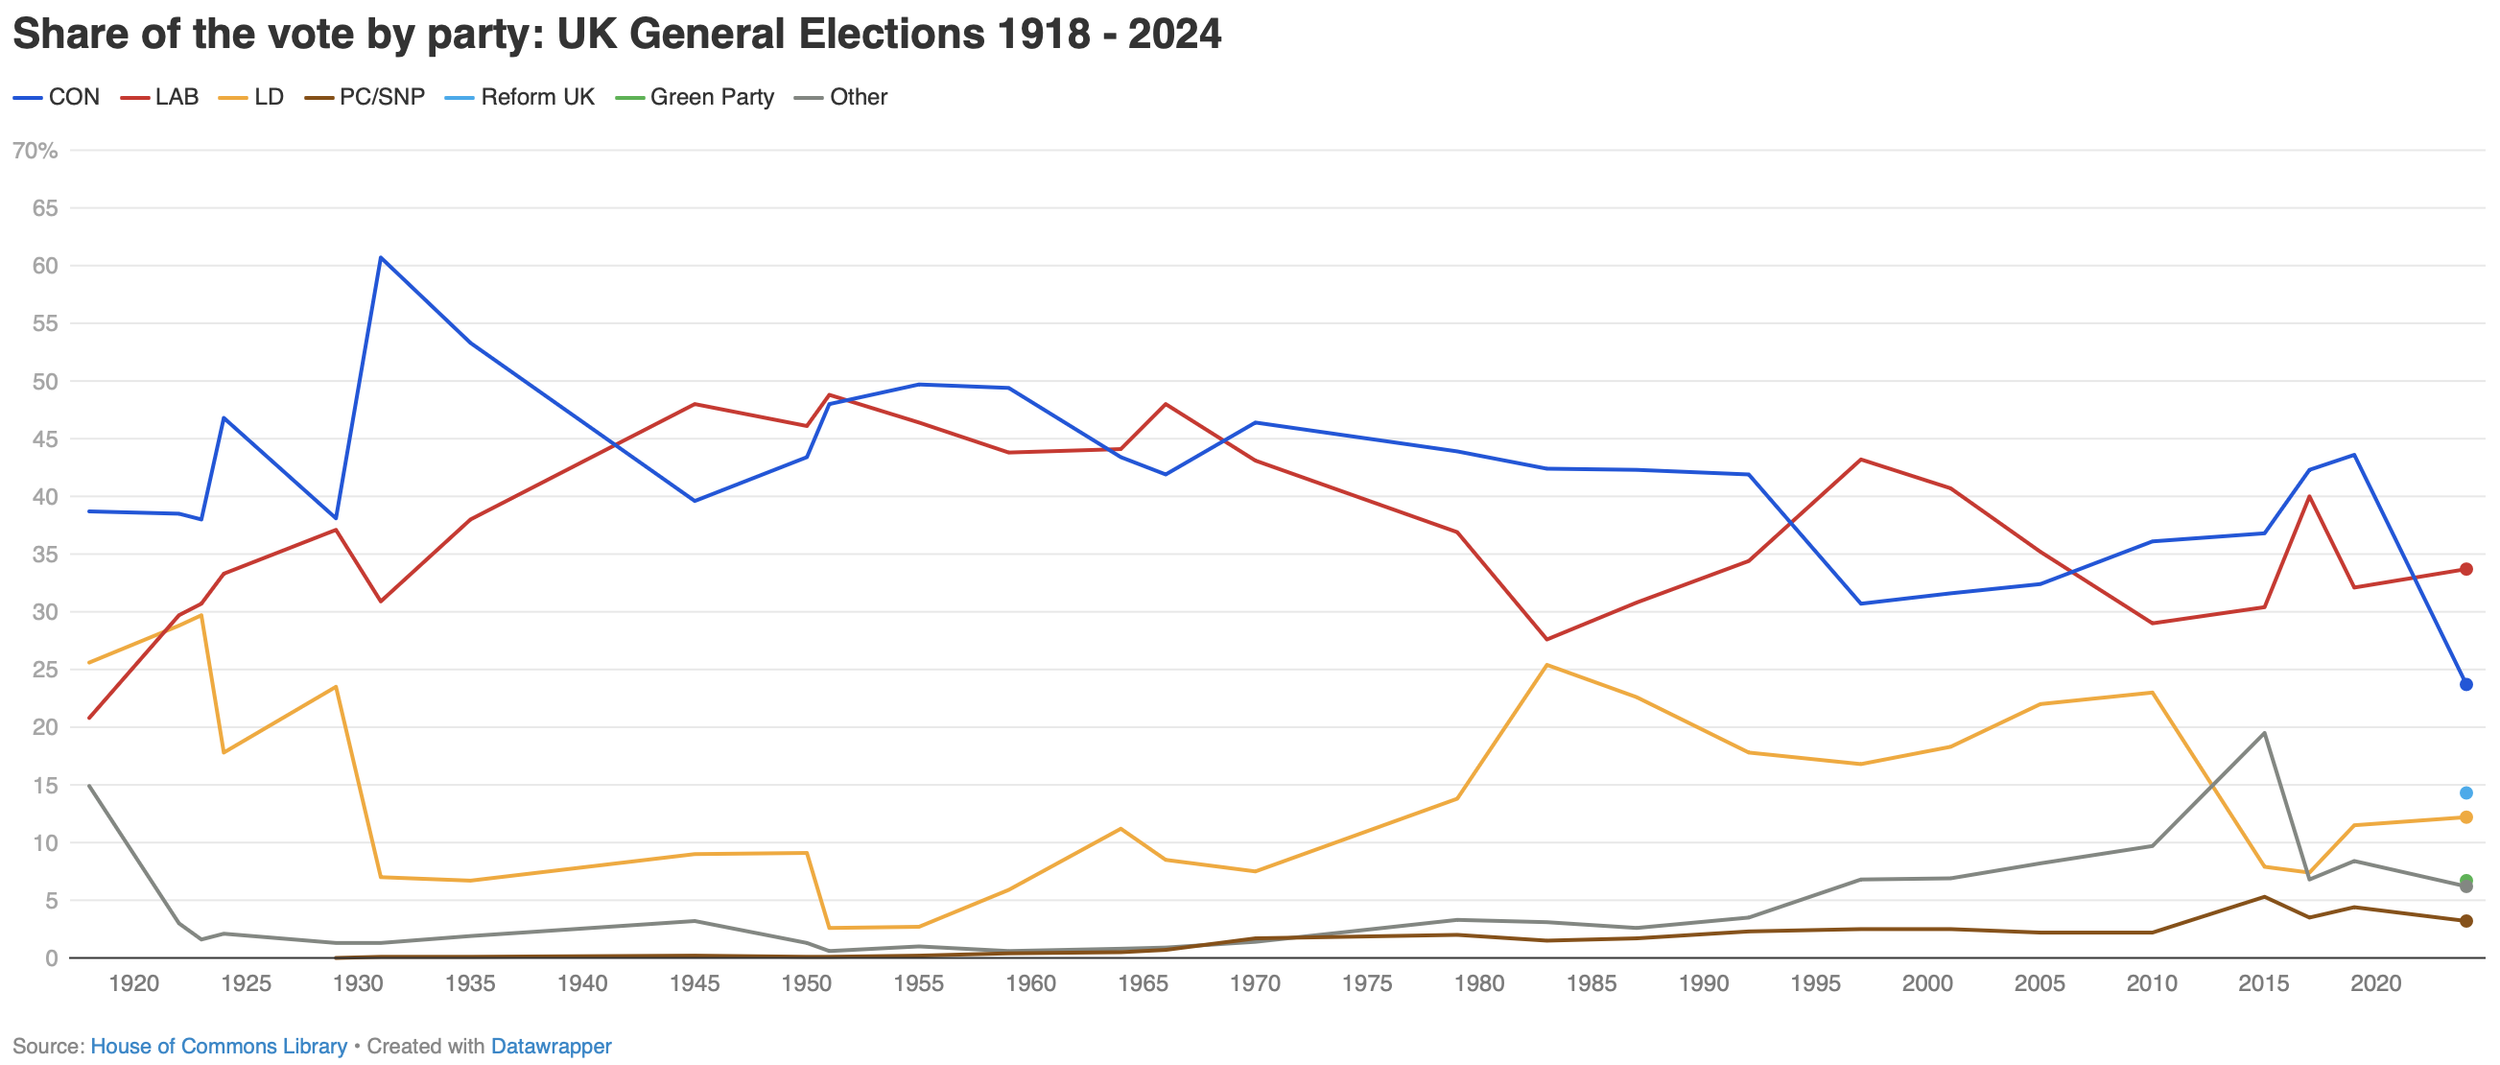
For the last 100 years only two governments have been formed with >50% of the votes. They were back in 1931 and 1935.
In fact the 2024 result was the lowest percentage that a winning party has received in that 100 years.
Credit to https://closer.ac.uk/data/share-vote-party/ for the following chart.
Here’s a quick but informative video from CGP Grey that explains why our First Past The Post voting method and Winner Takes all result is not a good thing for democracy.